
Introduction
The aim of this lesson is to provide students with an introduction to the LabVIEW development environment. The ‘LabVIEW’ name is derived from ‘Laboratory Virtual Instrument Engineering Workbench’ and refers to the object-oriented programming language produced by National Instruments (NI) primarily for the purpose of being used alongside their control and instrumentation hardware when developing data acquisition and control systems.
The benefits of using LabVIEW include:
- It provides a streamlined interface to NI devices, which offer engineers a vast range of capabilities for instrumentation, control, and data processing.
- It provides a programming environment specifically tailored to the creation of a Graphical User Interface (GUI) suitable for instrumentation and control purposes thus reducing the need for front end design expertise in the developer.
- It provides support to the developer by offering access to a library of pre-programmed functions, a detailed help system and thriving user community.
The main criticism of LabVIEW revolves around it being a propriety product of National Instruments and thus the software works best when integrated into larger NI hardware systems thus reducing flexibility in design. Critics may say that LabVIEW forms part of a ‘walled-garden’ ecosystem (aka. a closed platform) wherein software and hardware are mutually dependent, i.e., to realise the full functionality of any given part of the system (software or hardware) it requires the other. A walled-garden ecosystem incentivises developers to select or maintain sub-optimal parts of a proprietary system instead of seeking better options from alternative hardware or software suppliers.
This lesson shall cover the following topics:
- How to navigate the LabVIEW software environment.
- How to use the Front Panel window for front end design and the Block Diagram window for back-end development.
- How to use the controls, functions and tools palettes.
- How to build a simple Virtual Instrument.
- Dataflow through the Virtual Instrument.
The LabVIEW Visual Programming Environment
In LabVIEW, the program created by the developer is called a Virtual Instrument (VI) because their appearance and functionality, produced in software, is designed to imitate traditional physical instruments such as oscilloscopes, clocks and multimeters. As the traditional instruments would normally be operated by knobs, dials or buttons; many of the VI controls emulate these control mechanisms in the human machine interface (HMI). Similarly, many of the outputs form the VI take the form of waveforms, graphs or digital readouts similar to the output mechanisms found on traditional instruments.
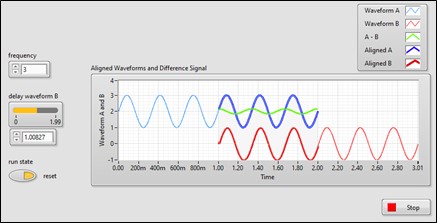
Figure 1: Screenshot of Virtual Instrument in LabVIEW
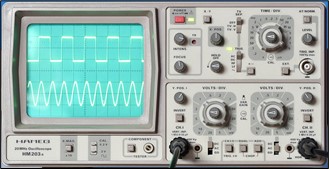
Figure 2: Traditional Oscilloscope
Each VI is contains two main parts, which are developed in parallel:
- The Front Panel, on which controls and indications are placed and which forms the end user’s HMI; and
- The Block Diagram, which controls the dataflow through the program and the code that is applied to process data.
Normally a VI is finished by defining its own icon and terminal set which provides a mean for connecting the VI to other VIs within a larger system.
The Front Panel
The Front Panel is where the developer can design the interface that the end user will interact with when the VI is running.
Note: In LabVIEW; a ‘control’ can generally be thought of as a program ‘input’ and an ‘indication’ as an ‘output’.

Figure 3: VI Front Panel
Users can control the virtual instrument by using the various knobs, dials, sliders, buttons, etc. available to them and see the resulting data presented in the indicators placed on the front panel.
In this picture, there are numeric and Boolean controls (e.g. the frequency and run state controls respectively). Numeric controls can be used to enter integers, floating point values, decimal values, etc. as defined by the programmer. Boolean controls can be used to enter a TRUE or FALSE value. The waveform graph is an indicator, displaying the results of multiple calculations. The various streams of data processing that form these calculations are programmed in the associated Block Diagram.
The Block Diagram
Every Front Panel developed in LabVIEW has an associated Block Diagram and each control or indicator placed on the Front Panel has a corresponding object on the Block Diagram. When a VI is run, inputted values (derived from controls) flow through the Block Diagram, where they are processed through the functions of the program, and the any results can be passed back to the Front Panel by indicators.

Figure 4: VI Block Diagram
The user-controlled inputs (knobs, dials, sliders, buttons, etc.) create variables through which data is inserted into the virtual instrument dataflow. Information is then transferred via wires to functions, subVIs, mathematical operators, etc., in which the information is processed. This processed data is then passed back to the front panel by indicators.
In this picture there are also a number of functions that affect the programming architecture, which may include timing functions, event structures, data aggregators/disaggregators and loops. Each of these functions will be considered in later lessons.
Standard Vis, SubVIs, Express VIs and Functions
LabVIEW uses various terms to describe programs that are differentiated by how they are used within the wider LabVIEW environment.
- The Standard VI is the basic program consisting of a Front Panel and associated Block Diagram, in which the program functionality is defined.
- The SubVI is a basically a standard VI that is placed within another VI to perform a particular job. In this case, the terminals of the SubVI are defined so that data can be passed into and retrieved from the SubVI to be used in the parent VI containing it. It is common to create a set of subVIs that contribute some basic function to be called upon within lots of other parent applications. This mitigates the need to reproduce that functionality in every new application.
- The Express VI are similar to the SubVI, in that they are placed within another application and perform a particular job. However, Express Vis are not interacted with via their Front Panel and Block Diagram instead being configurable via an associated dialogue box.

Figure 5: Example of an Express VI
- Finally, functions are the basic blocks that placed within the Block Diagram to execute a single function. An example may be a mathematical operator (such as the addition block), which takes two numeric inputs and provides the sum of these numbers as an output.
Controls, Functions and Tools Palettes
The LabVIEW VI is principally created by selecting, placing, and connecting various objects in the Front Panel and Block Diagram. These objects are selected from the Controls and Functions Palettes and manipulated using the Tools Palette.
Controls Palette
The Controls Palette contains the objects with which to create the Front Panel. Remember that the Front Panel forms the HMI through which the end user will interact with the VI and from which they will glean information from their application.
The Controls Palette can be displayed by right-clicking on the Front Panel or by selecting ‘Windows >> Show Controls Palette’.
Controls and Indicators can be placed by selecting them from within the Controls Palette and then clicking on the Front Panel in the desired location. Objects can then be moved, resized or redesigned as required to create the desired design of the interface.
Note that placing a Control or Indicator on the Front Panel simultaneously creates the associated object in the Block Diagram.

Figure 6: The Controls Palette
Functions Palette
The Functions Palette contains the objects with which to manipulate and process data as it flows through the application. Remember that the Block Diagram is analogous to the lines of code that would be written into a text-based programming language.
The Functions Palette can be displayed by right-clicking on the Block Diagram or by selecting ‘Windows >> Show Functions Palette’.
Functions can be placed by selecting them from within the Functions Palette and then clicking on the Block Diagram in the desired location. Objects can then be connected as required using wires to create the desired function of the VI.
Figure 7: The Functions Palette
Tools Palette
The Tools Palette is used to manipulate the objects placed both on the Front Panel and the Block Diagram. The tools are organised as illustrated.
- The Automatic Selection Tool is useful as it allows LabVIEW to select the tool that best suits the object over which the mouse is placed.
- The Operating Tool is used to change the value of a control object on the Front Panel.
- The Wiring Tool is used to interconnect functions in the Block Diagram.

Figure 8: The Tools Palette
The Toolbar
The Toolbar, presented in the Front Panel and Block Diagram windows, contains various controls and settings to work within the LabVIEW software environment as opposed to the specific VI being worked upon.
![]()
Figure 9: The LabVIEW Toolbar
From left to right, the toolbar buttons are:
- RUN Performs a single execution of the VI.
- CONTINUOUS RUN Performs multiple consecutive executions of the VI, continuing until aborted or paused.
- ABORT RUN Stops the VI.
Note that it is good practice to build a stop mechanism into the VI so that the VI ends in a known state.
- PAUSE Pauses the VI mid run. Pressing PAUSE again then continues the VI from its paused state.
- HIGHLIGHT EXECUTION Illustrates the dataflow through the Block Diagram.
- STEP INTO Steps into a structure within the Block Diagram (e.g.: a loop or SubVI).
- STEP OVER Executes the VI whilst skipping over the selected structure within the Block Diagram.
- STEP OUT Executes the VI whilst stepping out of the current structure within the Block Diagram.
- TEXT SETTINGS Used to change font settings (e.g.: size, style and colour)
- ALIGN OBJECTS Used to automatically move objects so that they are aligned (e.g.: aligned on a horizontal or vertical axis)
- DISTRIBUTE OBJECTS Used to automatically move objects so that they are evenly spaced.
- REORDER Used to reorganise objects placed in front of or behind other objects.
- CLEAN UP Allows LabVIEW to automatically reorganise the placement of objects into an uncomplicated format.
Exercise 1: Open and Run an Example VI
Launch the latest version of LabVIEW installed on your PC.
In LabVIEW 2020, the following welcome dialog window appears:
To open an example, select ‘Help >> Find Examples…’.
Examples can be browsed by category or keywords can be searched for using the ‘Search’ tab.
Selecting an example from this list will issue a description of the VI function in the information window.


Open the VI: ‘Waveform Generation Using Formula.vi’ either by searching for it using keywords or navigating to:
- ‘Analysis, Signal Processing and Mathematics >> Signal Processing >> Waveform Generation Using Formula.vi’
The example provides instructions on its use on the Front Panel. The VI can be ran to see its functionality in action. Selecting ‘Window >> Show Block Diagram’ will bring up the associated Block Diagram, which can also be examined to better understand the functionality of the VI. Users can quickly switch between the Front Panel and Block Diagram of a VI by using the keyboard shortcut ‘CRTL-E’.
Exercise 2: Building our First Virtual Instrument
In this exercise, we shall build our first basic Virtual Instrument from a blank VI template. The program shall take two inputs from the user and present both the sum and the product of these values in indicators placed on the Front Panel.

Figure 10: Exercise 1 Calculator VI
First, we shall place two controls (inputs) onto our Front Panel.
- Right click on the Front Panel to open the Controls Palette and select Numeric Control from the Numeric Folder.
- Left click on the Front Panel to place the object.
- Rename the object to ‘Input A’.
- Repeat for ‘Input B’.
- Change the values of Inputs A and B to any chosen value.
Press ‘CRTL-E’ to switch to the Block Diagram. Note that in creating a new object on the Front Panel, a corresponding terminal has been created on the Block Diagram. This terminal gives the code access to the input value selected on the Front Panel.


Note that the terminal in the Block Diagram is colour coded to illustrate the data type of the input. In our case, the object is labelled ‘DBL’ implying type ‘Double’ and is represented by the colour orange.
The default colour coding is presented in the following link, but note that the default colour scheme can be changed by an application developer and should therefore not be relied upon to reliably indicate the data type: https://knowledge.ni.com/KnowledgeArticleDetails?id=kA00Z0000019LsVSAU&l=en-GB
We shall now place two indicators (outputs) on our Front Panel.
- Right click on the Front Panel to open the Controls Palette and select Numeric Indicator from the Numeric Folder.
- Left click on the Front Panel to place the object.
- Rename the object to ‘A + B’.
Repeat for ‘A x B’.

Press ‘CRTL-E’ to switch to the Block Diagram. Note that the indicators are coloured the same as the controls, but controls have a thick border and terminals on the right whereas indicators have a thin border and terminals on the left. This intuitively tells us that data might flow out of a control and into an indicator.
Staying within the Block Diagram, we can now add the sum and product functionality to the program:
- Right click on the Block Diagram to open the Functions Palette and select Add from the Numeric Folder.
- Left click on the Block Diagram to place the object.
Repeat for the Multiply function.

We can now connect use the wiring tool to connect our functions, ensuring the correct flow of data through our program.
- Hover the mouse over the output terminal of the Input A block.
- Left click on the Terminal and then left click again on the destination terminal, e.g., the input terminal to the add function.
- Repeat to complete all connections as illustrated.
Note: each wire must have one but only one source, however, wires can have multiple destinations.

Press ‘CTRL-E’ to switch back to the Front Panel.
- You can add text the Front Panel by selecting the ‘Labelling Tool’ from the Tools Palette.
- You can further decorate the Front Panel using Decorations Folder from within the Controls Palette.
- Remember that you may want to move decorations to the fore or background. This can be done using the Reorder Button on the LabVIEW Toolbar.
- Once the Front Panel design is complete, press the Run Button on the LabVIEW Toolbar to check the functionality of the VI (using various values of Inputs A and B).
We shall be returning to this VI at a later stage. Save your VI using the ‘File >> Save As’ command and selecting an appropriate name and location for your program.
Dataflow through a VI
The term ‘dataflow’ is used here to describe the order in which data is processed through the application, i.e., the Block Diagram.
A node or function in the Block Diagram executes when all of its inputs become valid. On completion, the node/function supplies data to its output, and is passed along any connected data wires to the next node/function.
Consider the Block Diagram from the previous example. When Input A and Input B both supply data to the add function, it is then able to execute and supply the result of its calculation to the output A+B. Note that at the same time the multiplication function is also processing.
It is not possible to state whether the add or multiplication function processes before the other. If it was required that one should be executed before the other, a sequence structure would have to be implemented to control the dataflow in the Block Diagram.

It might be intuitive to believe that the Block Diagram processes data from left to right (or top to bottom) but this is not the case.
Consider the modified Block Diagram: When Input A and Input B both supply data to the multiplication function, it is able to execute. However, only after the output of the multiplication function is processed can it pass data to the input of the add function. Therefore, the add function will be executed after the multiplication function has already been completed regardless of where it is placed in the Block Diagram.

It is important to keep dataflow in mind when developing a LabVIEW VI. In later lessons, Block Diagram structures shall be introduced that give the developer greater control of the order of execution of the code.
Accessing LabVIEW Help
When building a LabVIEW VI, National Instruments provide extensive Help options that can be accessed.
- Context Help provides a basic information about the object that is currently selected
- LabVIEW Help provides a more comprehensive set of detailed information and manuals relating to the LabVIEW programming environment and its objects.
Context Help
To access Context Help, select ‘Help >> Show Context Help’ or press the ‘CTRL-H’ shortcut key. With Context Help activated move the cursor over objects in the Block Diagram or Front Panel to display basic descriptions of the functioning of that object.
LabVIEW Help
You can access the LabVIEW Help either by clicking the More Help button in the Context Help window, selecting ‘Help >> LabVIEW Help’ or press ‘CTRL-?’ shortcut key. The LabVIEW Help contains detailed descriptions of most palettes, menus, tools, VIs, and functions. It also includes step-by-step instructions for using LabVIEW features and links to the LabVIEW Tutorial, PDF versions of all the LabVIEW manuals and Application Notes, and technical support resources on the National Instruments Web site.
Exercise 3: Calculating the Area of a Field
In this exercise, students are required to create a program in LabVIEW (starting from the Blank VI template) in which a user enters length ‘L1’ and ‘L2’ of a rectangular field in meters. The VI should then calculate the resulting area of the field and the front panel should display the area of the field in metric and imperial units (m2 and ft2 respectively).
Students can assume that 1 ft = 30.48 cm.

Once completed, students should save the VI with an appropriate name, e.g.: ‘metric_imperial_area.vi’.
Summary
This lesson has introduced National Instruments LabVIEW software development environment. In this lesson, we have covered:
- How to navigate the LabVIEW software environment.
- How to use the front panel window for front end design and the block diagram window for back end development.
- How to use the controls, functions and tools palettes.
- How to build a simple virtual instrument.
- Dataflow through the virtual instrument.
In future lessons, we shall go on to cover:
- The various ways in which users can input, manipulate and output data in LabVIEW.
- How to show data in charts & graphs.
- How to implement complex programming functions, structures and architectures.