
Introduction
This lesson shall demonstrate the process of developing subVIs in LabVIEW. When a developer creates a VI (and defines an icon and connector pane for it) it can be used within another parent VI. When used in this manner it is known as a subVI. A subVI is analogous to a subroutine in a text-based programming language. The main purpose of using subVIs is to allow the developer to segment a complex code into several discrete parts, each with a well-defined scope and purpose. In doing so this makes the overall application less unwieldy and easier to debug when an error occurs.
This lesson shall describe:
- Debugging Tools in LabVIEW
- How to configure a VI so that it can be used as a subVI.
- How to call on the subVI from within another parent VI.
Debugging Tools in LabVIEW
LabVIEW offers various debugging tools to help a programmer find and fix a problem in their VI. Problems typically occur in two forms:
- Those that stop the VI from executing; and
- Those that generate undesirable or incorrect behaviour/result (whilst allowing the VI to execute).
Problem 1. The VI is nonexecutable
When the first problem occurs, LabVIEW informs the programmer by changing the run arrow in the LabVIEW Toolbar into a broken arrow icon.

Clicking on the broken arrow brings up a dialogue box that lists the errors and warnings that LabVIEW can detect in the VI.
Note that warnings (unlike errors) do not prevent a VI from being executed but are inform the programmer of potential errors in their design.
The ‘Details’ section of the dialogue box provides a description for the selected error and, in some cases, recommends how to correct them.
Clicking the ‘Show Error’ button or double-clicking the error description highlights the object on the block diagram or front panel where the error has arisen.

Problem 2. Tracing the roots of undesirable or incorrect behaviour/results
Finding the cause of undesirable behaviour or false results within a VI is typically harder to troubleshoot, however, LabVIEW does offer several tools that can be used to interrogate the application as it executes, which may make it easier to identify an issue.
 |
Execution Highlighting – Click the Highlight Execution button to animate the order of dataflow through the block diagram as it executes. Click the button again to disable execution highlighting. |
 |
Probe – Use the Probe Tool (by selecting the Probe from the Tools Palette and clicking on a wire of interest) to check intermediate values as the VI executes. |
 |
Breakpoint – Use the Breakpoint Tool (by selecting the Breakpoint from the Tools Palette and clicking on a wire of interest) to set different locations in the Block Diagram at which the programme will stop executing and intermediate values can once again be checked. |
SubVIs
As stated in the introduction, a subVI is a VI that can be used within another parent VI. The advantages to using subVIs is that they enable modular design, making the code easier to debug, avoiding the need to recreate existing code and requiring less memory.
In this lesson we shall be creating a VI using the basic calculator that we programmed in Exercise 1 of the previous lesson.
After you build a VI and create its icon and connector pane, you can use it as a subVI within another VI. In general, the following steps should be followed:
- Create an Icon
- Setup the Connector Pane
- Assign Terminals within the Connector Pane
- Save the VI
- Insert the saved VI into a new VI

Figure 1: Basic Calculator VI Developed in Exercise 1
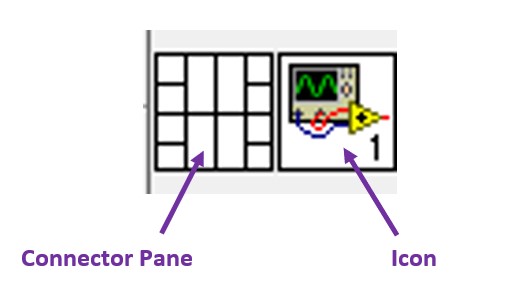
The Icon and Connector Pane is defined in the top right of the LabVIEW Front Panel window:
- The Icon represents a VI in another block diagram
A connector shows available terminals for data transfer
To replace the default icon, double click the icon in the top right of the Front Panel window or right click and select ‘Edit Icon’.
Use the tools of the Icon Editor dialog box to create a new icon design in the editing area.
Note: you also can drag an image file from your PCs file system and drop it onto the Icon (in the Front Panel) and LabVIEW will convert that image into a suitable graphic for use as an icon.

Figure 2: Icon Editor Dialogue Box
The Connector Pane is a set of terminals that corresponds to the controls and indicators of the VI. It is in the connector pane that the programmer defines the inputs and outputs to the VI, analogous to the parameters passed into a function call in a text-based programming language.
The number of input and output terminals presented on a subVI depends on those control and indicator assignments, but a specific pattern of terminals can also be setup by right clicking the Connector Pane and selecting from ‘Patterns’.
Our basic calculator VI has two controls and two indicators, so we may want to select a basic 2x2 pattern of connectors.
Figure 3: Connector Pane - Standard Pattern Options
Parameters are assigned in the Connector Pane by linking a front panel control or indicator to each terminal.
Note it is good practice to link inputs on the left and outputs on the right of the Connector Pane.
To assign a terminal, click a terminal of the connector pane, then click the Front Panel object you want to assign.
Repeat this process for all inputs and outputs.
Note: The terminal changes colour changes to match the data type of the control/indicator linked to it.

terminal options
After you build a VI and create its icon and connector pane, you can use it as a subVI.
Open a new blank VI, on the Block Diagram To place a subVI on the block diagram, select ‘select a VI’ from the Functions Palette. Navigate to your saved VI and insert it into the Block Diagram.
To test your subVI, insert some basic numeric inputs and indicators on the front panel and some additional mathematical functions on the block diagram. Run the VI and check whether the indicators are as you would expect.

Once a VI contains subVIs it may be useful to see the VI hierarchy, an illustration of the VIs and subVIs contained within an application.
To view the VI hierarchy, select, ‘View >> VI Hierarchy’.

Tips for Working in LabVIEW
LabVIEW has several shortcut keys to improve the experience of working in the LabVIEW environment:
- CTRL-E – Switches between the Front Panel and the Block Diagram windows
- CTRL-H – Toggles the Context Help window.
- CTRL-B – Removes broken wires from the Block Diagram
- SHIFT-Tab – Toggles the Automatic Selection Tool ON or OFF
- Tab – Toggles across several common tools (when Automatic Selection Tool is disabled)
Select ‘Tools >> Options’ to open a dialog window containing many configurable parameters for the LabVIEW software environment including: Front Panel/Block Diagram customisation options, appearance options, printing options, etc.
Select ‘File >> VI Properties’ to open a dialog window contain many configurable parameters associated with the particular VI that is current being worked upon.
Summary
This lesson has introduced the concept of subVIs, demonstrating:
- What is a subVI.
- How to create a subVI.
- How to insert and use a subVI within another VI.
- VI Hierarchy.
This lesson also covered:
- LabVIEW’s debugging tools, and
- Some additional tips for working within LabVIEW.
In future lessons, we shall go on to cover:
- The various ways in which users can input, manipulate and output data in LabVIEW.
- How to show data in charts & graphs.
- How to implement complex programming functions, structures and architectures.